
SocialHi5 gets it right Modern day businesses jump into Online Marketing bandwagon armed with carefully designed strategies and tactics. In fact, they leave no stone unturned in ensuring the optimal usage of all online marketing channels. But with same strength and vigor, do businesses measure the effectiveness of all their online marketing efforts? The success of Online Marketing depends much on measuring, analyzing the efforts and fine-tuning the strategy continually. What to measure? Where to measure? These two questions on measuring the effectiveness continue to haunt many businesses which have embraced the online marketing channel.
To measure the effectiveness one needs to depend solely on the Analytics of each and every single activity undertaken. When these analytics are properly analyzed, it will shed crucial insights to businesses on two areas. One is where to spend time and resources, and the other where to fish out prospective customers.
SocialHi5 through its in-house tool offers analytics on various fronts especially on websites, Landing Pages, Leads acquired through Facebook/Google, Sales, Facebook metrics and Google Metrics. This report on bunch of analytics will be presented to the clients on an easy-to-interpret format supplemented with graphs and charts. The following are the objectives of the report.
a. To provide sufficient insights enabling the businesses to make intelligent decisions on online marketing front.
b. To demonstrate the ROI of online marketing program, thus enabling them to figure out the success ratio.
Characteristics of SocialHi5 Analytics Report:
Leads Acquisition Metrics:
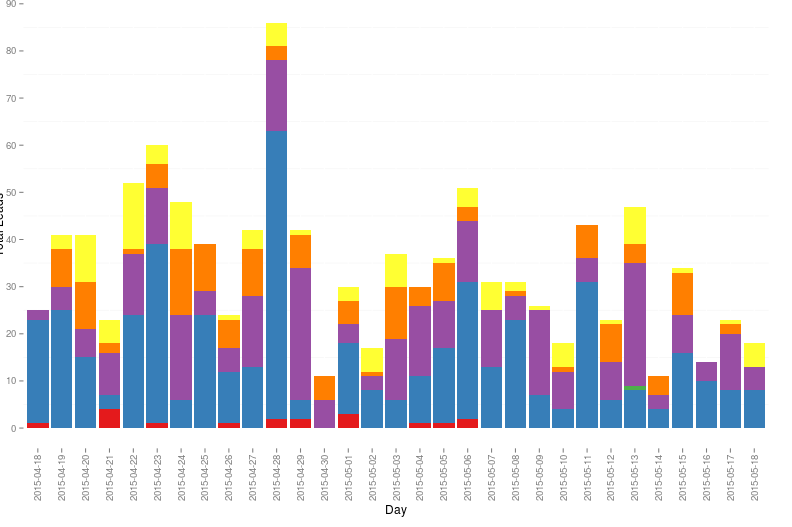
The graph in this figure demonstrates the total number of leads acquired through Facebook/Google with respect to campaigns over a particular period. Also it clearly highlights the Contact Number for which maximum leads were acquired.
In this way, a business can identify the best performing and least performing campaigns and make some tweaks to the underperforming one so as to make it perform well.
Sales Conversion Metrics:
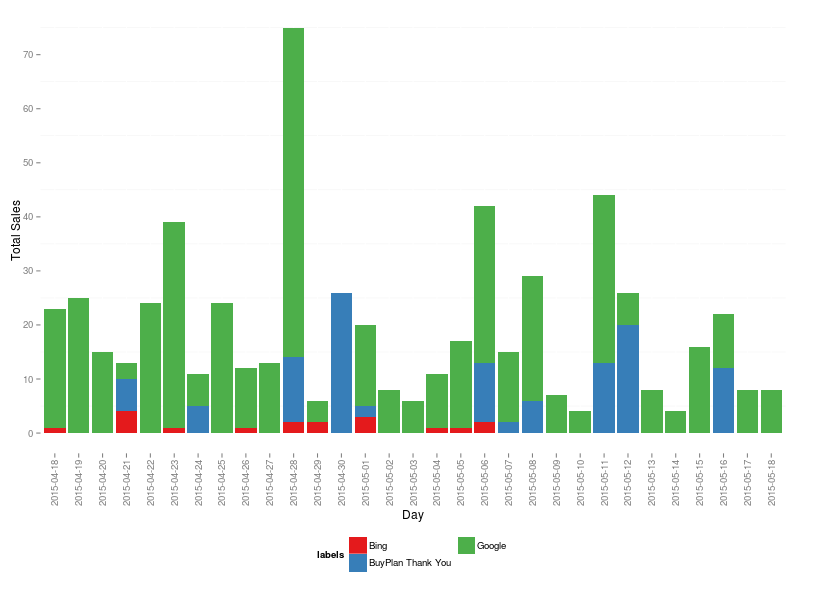
The graph in this figure highlights the total number of conversions occurred out of a campaign resulting in sale(s) over a particular period. It also highlights the Cost incurred for a sale.
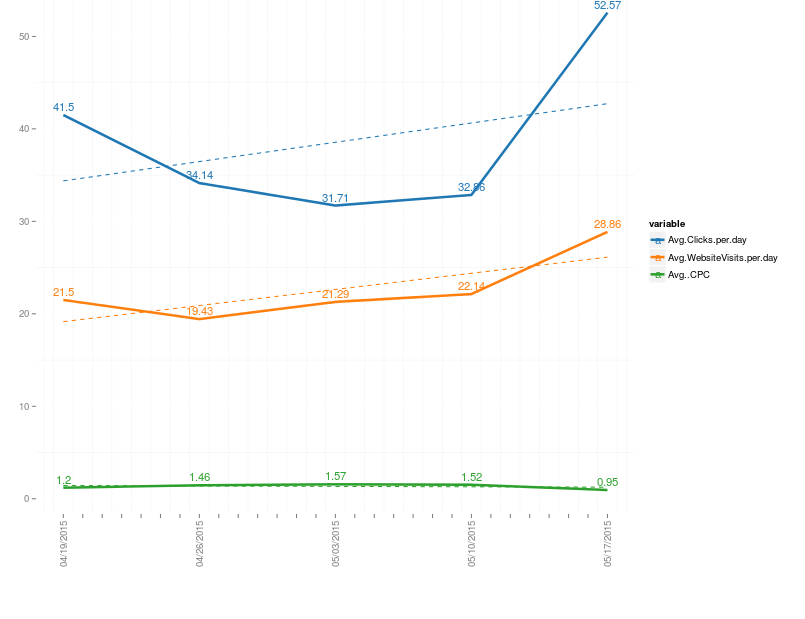
FacebookMetrics
The graph in this figure highlights the Average number of clicks received per day, and also the average number of visitors landing in the website by clicking through ads. Moreover it showcases the increasing/decreasing trend of Cost per click incurred for ads.
Google Metrics:
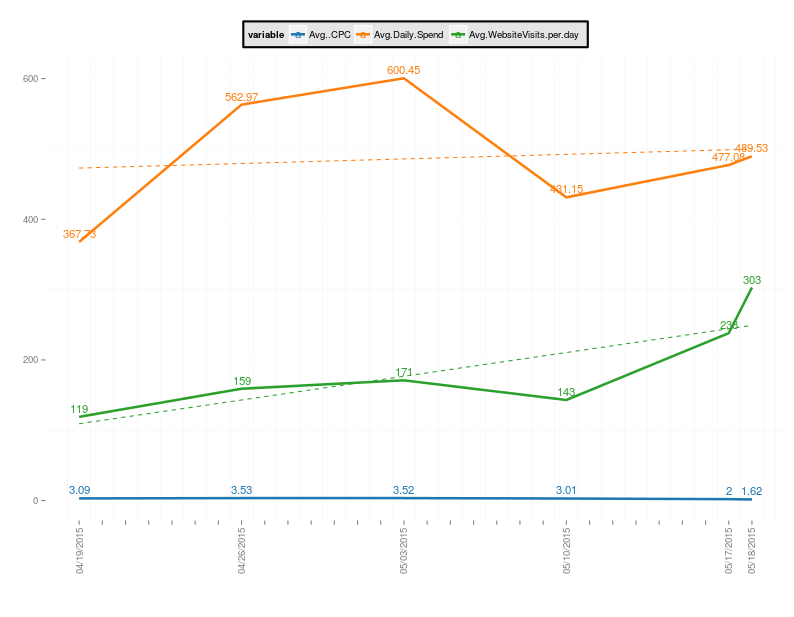
The graph in this figure highlights the Average cost per click of active ads and the Average Daily spend incurred on active ads. It also portrays the increasing/decreasing trend of website visitors per day.
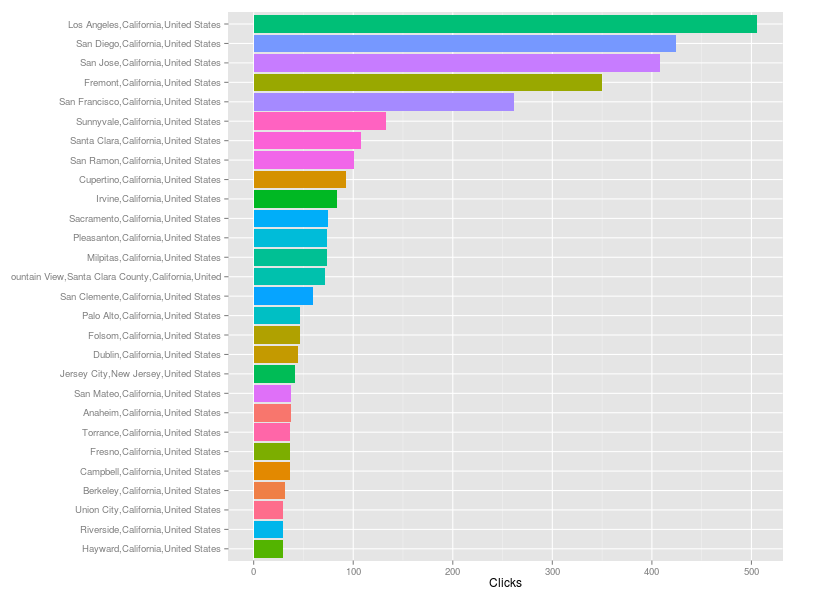
Clicks- Geographic Distribution:
The graph in this figure will provide crucial inputs in terms of the Geographical Distribution of clicks. Through this graph a business can identify the highest and the lowest number of clicks received from a particular geography. This will enable the business to tweak the budget spent on ads which has received the lowest number of clicks.
Google Analytics:
Through this figure a business can identify the number of visitors (sessions) to the website through different search engines and social media networks. It also highlights the website traffic through organic search, paid search and through referral websites.
With the help of all the above metrics, businesses would be in a position to identify the effectiveness of each single Online Marketing effort. Fine tuning the strategy of under performing effort and measuring the response will bring out success in the long run.
SocialHi5 is ready to help your business through its result-proven solutions.
Call us @ (916)476-2427 or Drop us an email with your requirements to info@blog.socialhi5.com